Sunday, 10 April 2016

Risk Reward Math and our Human Behavior

Risk Reward Math,

Are you trading with proper Risk/Reward Ratio?

Yes ,Then You already Know how to calculate

Example-
Suppose you are open your position in Nifty for target 7267,stop-loss is 7612(closing basis) and  sell entry price is 7558.

Risk/Reward=(Target-Entry)/(Stop loss-Entry)=abs(7267-7558)/ (7612-7558)=5.38.

Case I-Sometimes stock./market trigger your stop loss and return to their path in that direction you have taken your position.


If you are too emotional in your trading then you decide to wait for Next day or wait for second confirmation suppose say nifty at 7439.


Next Day market suppose gap down at 7400.Then it is our Human behavior or ego to skip that day  and  wait for bounce to 7500/7558 next Day.


Again next day suppose Nifty opens at 7385 and again drift down.So we missed that opportunity wait for next signal.


Case II-Suppose you have taken your position in mind that 7612 stop loss on closing basis.Nifty suppose crosss 7612 by 20 points then you don't  know the next resistance.So you may reverse your position.


So what???


Most important things is that if you don't know the oscillation of that specific stock/index,then you missed that opportunity or Trade in Buy side at 7630. So before taking the trade know that where is heading stocks/indices are.


Note-Soch Samajh Kar Invest Kar and control your Greedy and fear(human Behavior)

Market's Einstein, Newton & S N Bose Theorem


Action at Distance from centre.


Sorry Again We left two more legend’s Principle

Is market movement based upon Sir Isaac Newton???

Action at a distance, across a vacuum, he might not have developed his theory of gravity.


Sir Isaac Newton (25 December 1642 – 20 March 1726) was an English physicist and mathematician


Had he not relied on the occult idea of action at a distance, across a vacuum, he might not have developed his theory of gravity. The Sun and all the Planets is to be esteemed the Centre of the World", and this centre of gravity "either is at rest or moves uniformly forward in a right line" (Newton adopted the "at rest" alternative in view of common consent that the centre, wherever it was, was at rest).


“At rest” of Newton Theory latter confirmed by Albert Einstein as Relative Motion of each objects is in the universe.


So what???


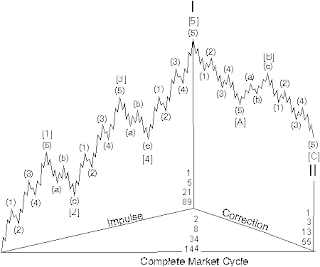
When stock price moves distance from centre of Gravity,Action and Reaction takes place in the form Action at Distance from centre in terms of Impulsives and Correctives wave of R N Elliott.


Do you Know that Sir Isaac Newton fails many time to predict the Law of Gravity i.e when stock price moves or distance from centre falls at the greater force.


Let us see the Investment of Sir Isaac Newton>>>

Test your IQ>>>

And last but not Least>>>>Continue


Is market movement based upon Satyendra Nath Bose ???

Satyendra Nath Bose (Bengali (1 January 1894 – 4 February 1974) was a Bengali physicist specializing in mathematical physics. He is best known for his work on quantum mechanics in the early 1920s. he was awarded India's second highest civilian award, the Padma Vibhushan in 1954 by the Government of India.


Satyendra Nath Bose, who recognized that a collection of identical and indistinguishable particles can be distributed in this way. The idea was later adopted and extended by Albert Einstein in collaboration with Bose.


The Bose–Einstein statistics apply only to those particles not limited to single occupancy of the same state—that is, particles that do not obey the Pauli exclusion principle restrictions. Such particles have integer values of spin and are named bosons, after the statistics that correctly describe their behaviour. There must also be no significant interaction between the particles.


I am try to decoding Here the last but not least Mathematical Physics of Satyendra Nath Bose in the context of Stock/market Price Movement.


“collection of identical and indistinguishable particles” of S N Bose means (collection of identical i.e not able to be identified as different or distinct) particles(stock Buyer or stock Seller) are in forcefully move the stock price in that direction where force/energy/frequency/natural vibration/stock volume was there .


Such particles have integer values of spin(stock direction) and are named bosons(volume), after the statistics that correctly describe their behaviour. There must also be no significant interaction between the particles(buyers to buyers or sellers to sellers).

Based upon all Legend's ,i conclude that Market/stocks  Price(Number) move always in Simple Harmonic Motion or some frequency which leads to Vibration in terms of Wave.
What is SHM>>
What is Natural Frequency>>>


So When you trade in particular stock/indices do some Home work,study long term chart atleast 2-3 years.
Do You know after some loss booked by Gann at earlier stage.Gann has studied almost 100 years chart conclude that each numbers have some Vibration.


As I am studying of above Mathematical Physics of Great legends in context with Stock Price. Corrects if Any mistake in typing.Let me know your ideas.


So Please coments /like/follow or share your views with me so that we grow in the grace knowledge.


Disclamier-I am publishing this post for mere educational purpose. All other content(s), viz., Math,Physics, Investment Psychology, Image,biography,Cartoons from external sources etc are all to give additional ambiance and make the reader more enlightening. As the markets are super dynamic by nature, you are assumed to be exercising discretion and constraint as per your emotional, financial and other resources.


This blog will never ever create rumors or have any intention for bad propaganda. We report rumors and hear-say but never create the same. This is for your information education and assessment. For more information please read our Disclaimer.

elliott wave & Gann Math

Is Market Price movement based upon R N Elliott???

Ralph Nelson Elliott (28 July 1871–15 January 1948) was an American Accountant and author, whose study of stock market data led him to develop the wave Principle a form of technical Analysis that identifies trend in the financial markets. He proposed that market prices unfold in specific patterns, which practitioners today call Elliott waves


Is Market Price movement based upon W D Gann???


William Delbert Gann (June 6, 1878 – June 18, 1955) or WD Gann, was a finance trader who developed the technical analysis tools known as Gann angles, Square of 9,Hexagon, Circle of 360 (these are Master charts). Gann market forecasting methods are based on geometry, astronomy and astrology, and ancient mathematics


So What???


All above Great people are said that Each objects or particle( protons, neutrons, and electrons) or Molecules in this universe have a natural frequency or natural scale of vibration.


So stock Price movement based upon>>>


Mathematics,Geometry,Trigonometry,Geography,Physics,Chemistry etc more often Natural Frequency.

Great Gann said each number(stockprice) is a energy Packet.

Oh Sorry How we have forgotten E=Mc2.

Is market movement based upon Albert Einstein ???


Albert Einstein (14 March 1879 – 18 April 1955) was a German-born theoretical physicist. He developed the general theory of relativity, one of the two pillars of modern physics (alongside quantum mechanics).


All Economies and Markets Are in Relative Motion


Einstein and others gave us a universe where galaxies are moving while also exerting forces on each other.

Is in Elliott wave 1,2,3,4,5 etc follow Energy=Mc2???


Is Elliott wave 3 has more energy/power/frequency(higher volume) than elliott wave 1.


Yes>>>


So stock market follow E=Mc2 .

Although physics and economics both speak the language of math, there is one difference – i.e human behavior.

We are unable to calculate the energy of individual human behavior in stock market context.


But we can calculate and see the force of trading volume as mass human behavior.


This means that observations, trading strategies and market theories may holds up for a long time for expectation (bullish/bearish) and then suddenly fail, Which is in the form of impulsive and corrective wave. Action at Distance from centre.

Market's Pascal and Fibonacci math


Is Market Price movement based upon Pascal’s Triangle???

Can we find the Fibonacci Numbers in Pascal's Triangle?Yes! The answer lies in the diagonals in the triangle.


Why do the Diagonals sum to Fibonacci numbers?

Fibonacci's Rabbit Generations and Pascal's Triangle

Here's another explanation of how the Pascal triangle numbers sum to give the Fibonacci numbers, this time explained in terms of our original rabbit problem.

Let's return to Fibonacci's rabbit problem and look at it another way. We shall be returning to it several more times yet in these pages - and each time we will discover something different!


We shall make a family tree of the rabbits but this time we shall be interested only in the females and ignore any males in the population. If you like, in the diagram of the rabbit pairs shown here, assume that the rabbit on the left of each pair is male (say) and so the other is female. Now ignore the rabbit on the left in each pair!


We will assume that each mating produces exactly one female and perhaps some males too but we only show the females in the diagram on the left. Also in the diagram on the left we see that each individual rabbit appears several times. For instance, the original brown female was mated with a while male and, since they never die, they both appear once on every line.

Now, in our new family tree diagram, each female rabbit will appear only once. As more rabbits are born, so the Family tree grows adding a new entry for each newly born female.


Inspirational Quotes

Inspired for Next Week by this Quotes

Market's Pythagorean theorem

How stock Market works or according to which set of Rules or Law....

Guess...

Is Market Price movement based upon Pythagorean theorem???
The theorem is named after

the ancient Greek mathematician Pythagoras (c. 570 – c. 495 BC)

Is Market Price movement based upon Fibonacci Numbers Series???

Fibonacci Numbers Series
0, 1, 1, 2, 3, 5, 8, 13, 21, 34, 55, 89, 144, 233, 377, 610, 987 ..


As I am studying of above Mathematical Physics of Great legends in context with Stock Price. Corrects if Any mistake in typing.
So Please coments /like/follow or share your views with me show that we grow in the grace knowledge.

Disclamier-I am publish this post for educational purpose. All other content(s), viz., Math,Physics, Investment Psychology, Image,Cartoons, etc are all to give additional ambiance and make the reader more enlightening. As the markets are super dynamic by  nature, you are assumed to be exercising discretion and constraint as per your emotional, financial and other resources. 

This blog will never ever create rumors or have any intention for bad propaganda. We report rumors and hear-say but never create the same. This is for your information education and assessment. For more information please read our 
Risk Disclaimer .